


Photo by Markus Spiske on Unsplash
Make money with cryptocurrencies - Trend Lines
Understanding trendlines and their purpose


Introduction
Trend lines are the very basis when you want to realize a technical analysis of a chart. It should always be your first reflex when you are beginning the study of a given chart. It will help you understand how the crypto is evolving, where it is coming from and where it is going.
Not starting with this very fist step and trying to draw more difficult patterns will probably lead to avoidable mistakes. Even professionals sometimes want to go faster and don't do that preliminary work, but they do understand the higher risk of failure.
With practicing, you will be able to notice trend lines without currently drawing it; but in your head, you know where they are.
Our first trend lines
Let's try to understand trend lines by using an example.
 by LonesomeTheBlue
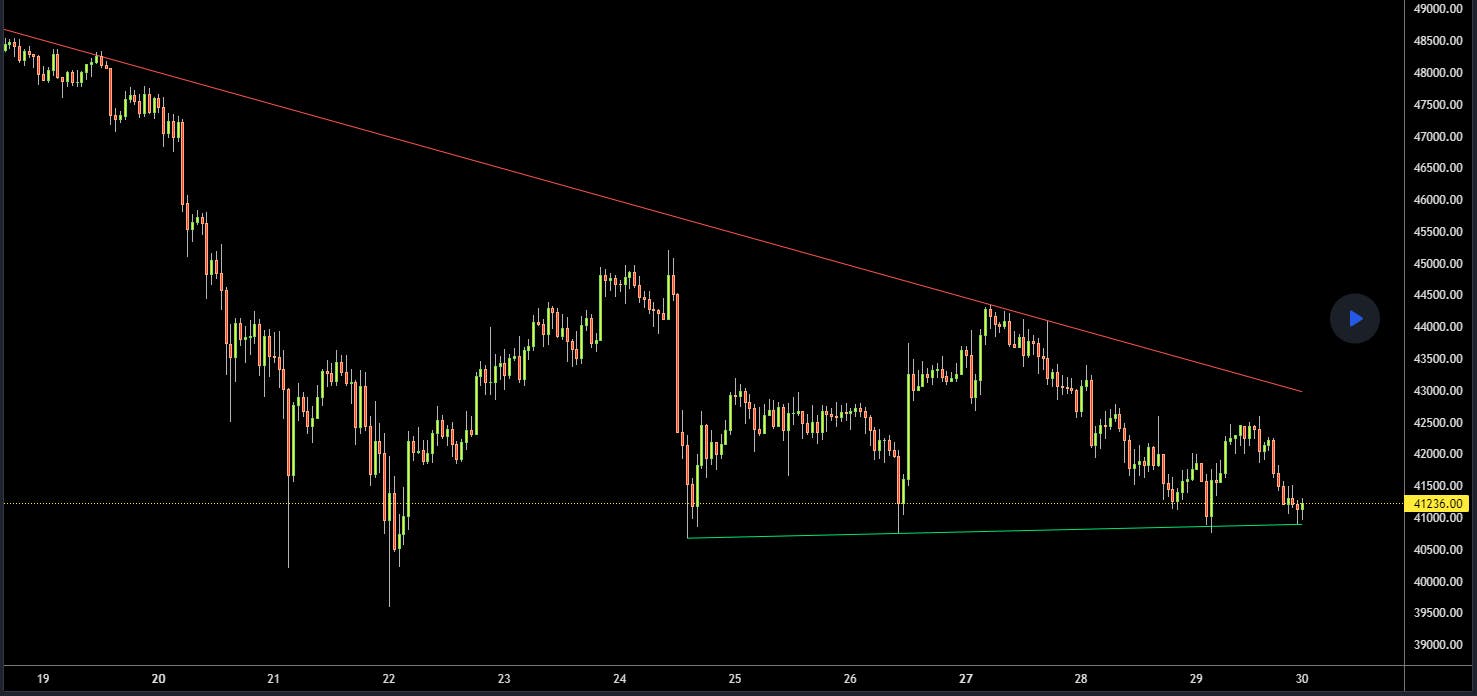
Here we can see two trend lines:
- a red one showing a global regression of the stock price
- a green one, showing a resistance line (we will talk about it a bit later in this chapter)
These lines are useful to understand the global trend of a crypto. Give it a try by drawing these lines between summits of the chart you are analyzing. The more you practice, the better you will become. A trendline must meet a few summits (ideally, at least 3 to be taken seriously).
Support & Resistance
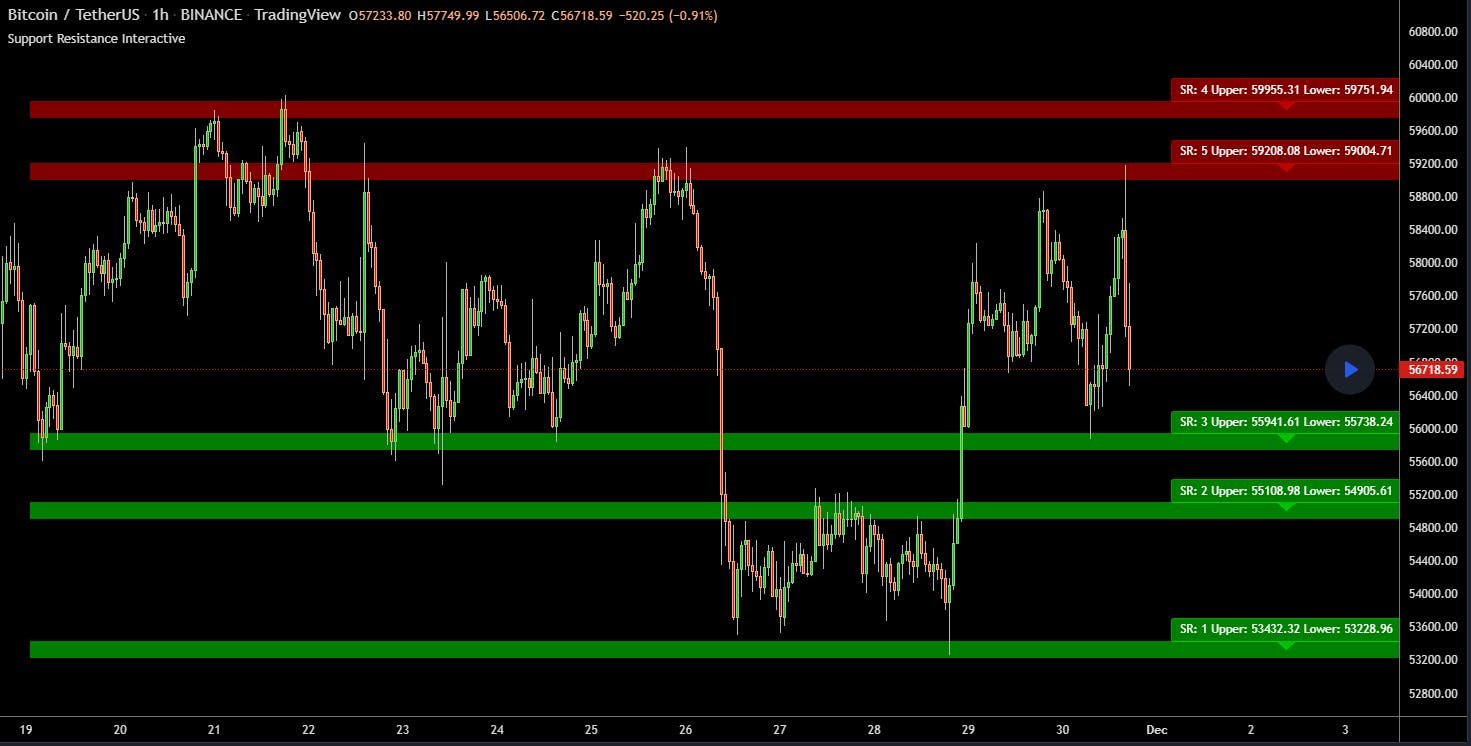
Support and resistance can be seen as trend lines. The goal is to show when a stock price is reaching a resistance, or using a support to avoid falling too much.
 by LonesomeTheBlue
As you can see, this kind of trend lines are horizontally drawn, when multiples summits are hit. It will give you a nice view of where the crypto may bounce back, or where it will struggle to go higher.
by LonesomeTheBlue
As you can see, this kind of trend lines are horizontally drawn, when multiples summits are hit. It will give you a nice view of where the crypto may bounce back, or where it will struggle to go higher.
We hope this article will be useful in your journey to understand technical analysis of chart. It will be updated from time to time to add new information and keep it as clean and understandable as possible!